How to Use the Quantified Knife Project
Knife Listing Table
Each knife we tested is listed here, along with a few key performance metrics. The table is sorted by average Food Cutting Rank by default. The blended performance measure in this column indicates, overall, how well each knife performed on food cutting tests. The metric is calculated by taking each knife’s average score on the five trials of a cutting test for one food item, ranking that score against those of the other blades (a rank of 1 is best), and then averaging the rankings for all five tested foods. A lower number means better performance.The table also includes the values for each knife’s BESS score (which measures initial sharpness) and CATRA score (which measures edge retention). The price information reflects each knife’s advertised MSRP (Manufacturer’s Suggested Retail Price), ignoring any temporary sale or discount pricing. This pricing information is accurate as of August 2024, but may be subject to change by the manufacturers.
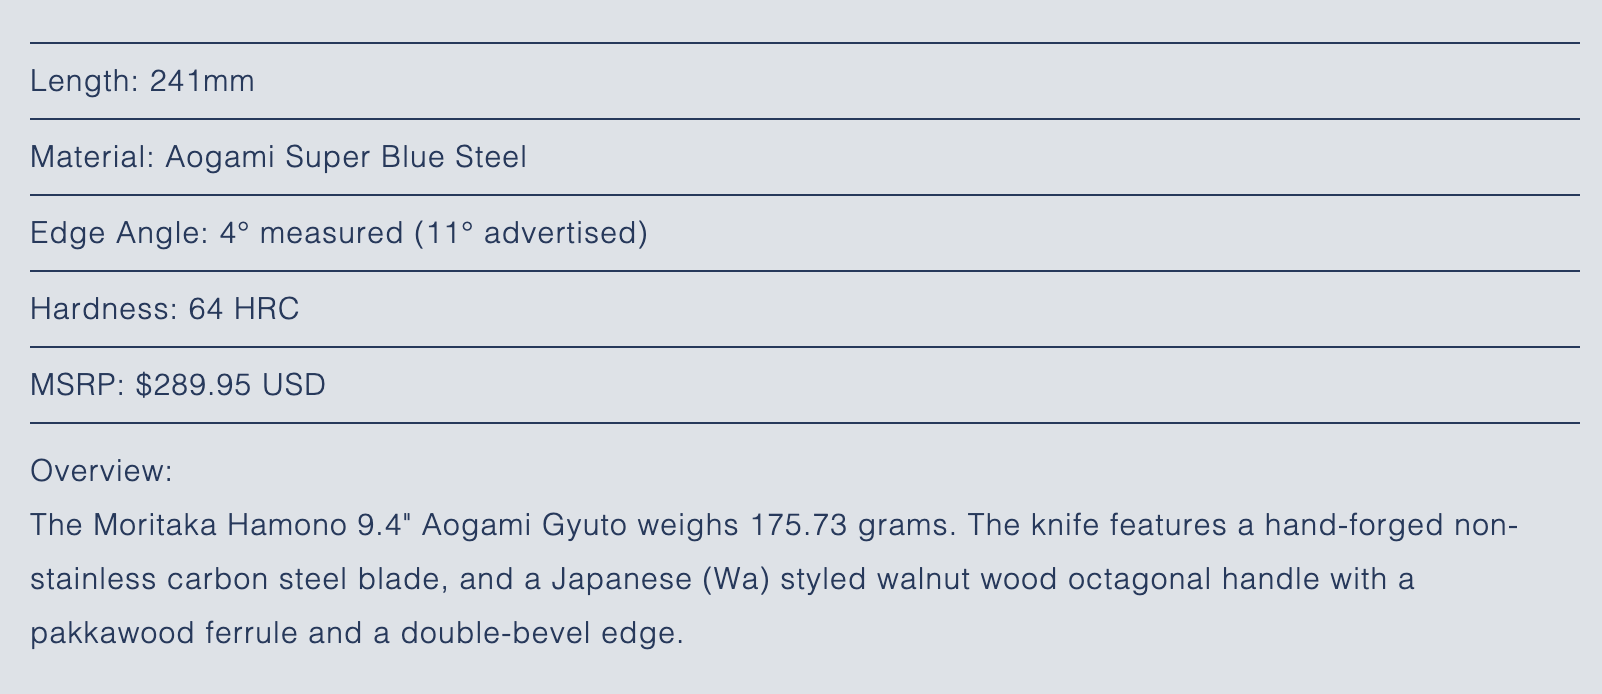
Knife Specifications
Length refers to the length of the blade only and does not include the length of the handle. We measured this value directly.
Material is the type of steel used in the knife blade. We used the information provided by the manufacturers but did not directly verify these values ourselves.
Edge Angle is the angle of one side of the cutting edge (also referred to as the secondary bevel) with respect to the midline of the blade. Most manufacturers advertise an edge angle range, and we’ve included those values when available. We also directly measured the edge angles using a CATRA laser goniometer.
Hardness refers to the blade’s score on the Rockwell Hardness C (HRC) scale. We used hardness numbers provided by the manufacturers but have not verified these values through direct testing.
MSRP is the Manufacturer’s Suggested Retail Price of the knife, ignoring any temporary sale or discount pricing. This pricing information is accurate as of August 2024, but may be subject to change by the manufacturers.
Overview provides additional information taken from direct measurements and manufacturer-provided specifications.
Key Results
We analyzed the performance of each knife and summarized our key observations in this section. Some knives had outstanding performance in key areas of testing; other knives were unremarkable, or middle-of-the-pack, across tests. These summaries were written by humans, not AI.
Food Cutting Tests
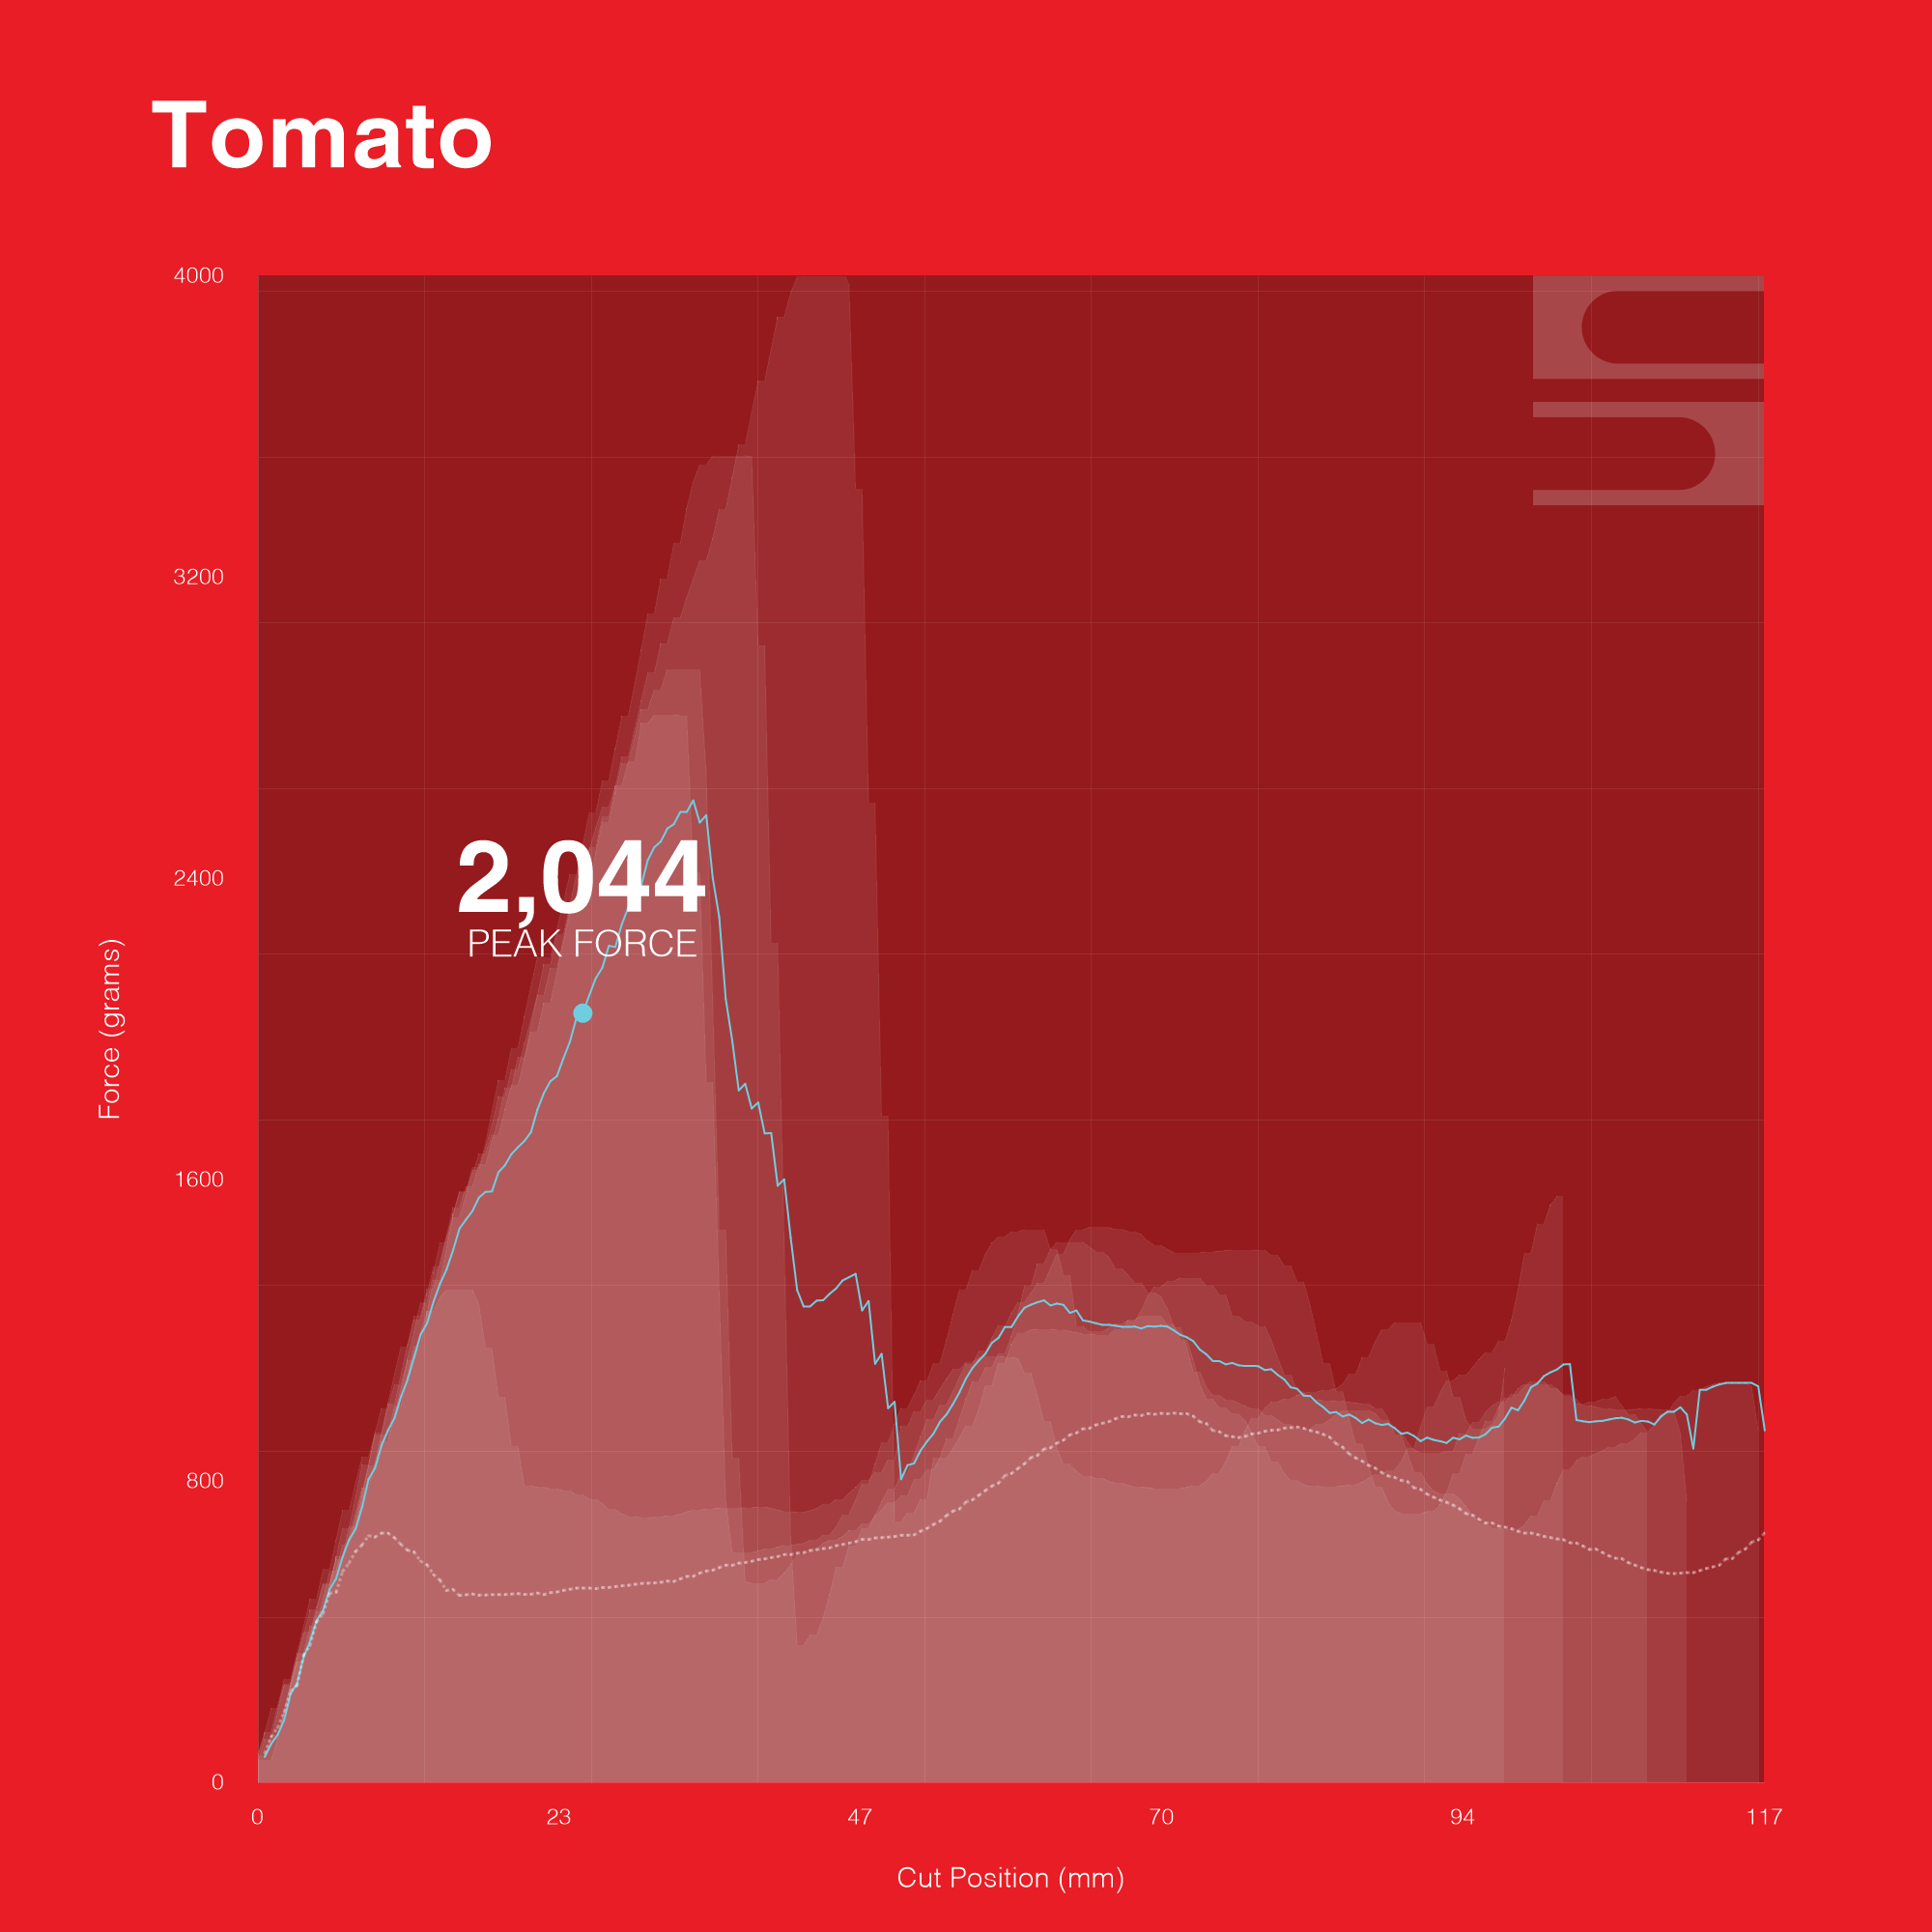
These charts display the forces required to cut through various foods for each knife. To ensure that the tests were as objective and repeatable as possible, we mounted each blade on a robot arm that executed precisely the same movement in every trial: a slicing motion for tomatoes, potatoes, and bread, and a push-cutting movement for carrots and cheese. These movements were designed to replicate the way a human would cut these foods.
The x-axis shows the distance traveled by the blade, in millimeters, as it cuts through the food. The y-axis shows the amount of downward force, in grams, recorded at each point in the cutting movement.
The white, filled-in areas of the chart show each of the five trials per food. This visualization lets us analyze how similar or different one trial was from another. One reason for the variation among trials could be the natural differences in size and shape between any two tomatoes, for instance. Trials that had very similar results will show greater overlap on these charts.
The colored, dotted line shows the average of the five trials. The average is calculated by averaging the force values (y) for each position point (x) of the blade over the course of its movement. This average smooths out irregularities among the food samples.
Each food is summarized by a key performance metric meant to represent the human experience of cutting that particular food.
- For tomatoes, the key metric is peak force: the maximum force exerted before piercing the skin of the tomato.
- For potatoes, the key metric is average force: as the blade slices through the potato, what’s the average resistance to cutting?
- For carrots, the key metric is maximum force: how hard does the knife have to push down on the carrot before the carrot snaps?
- For cheese, the key metric is total force: how much force does it take to cut, applied over the entire distance of the cut?
- For bread, the key metric is maximum force: as the soft bread compresses under the blade, how much force was required to complete the cut?
Finally, the white, dotted line displays the average performance of the top-scoring knife in this test, as measured by the test’s key metric. This provides a benchmark by which you can compare any individual knife to the best scorer in the bunch.
High-Magnification Blade Images
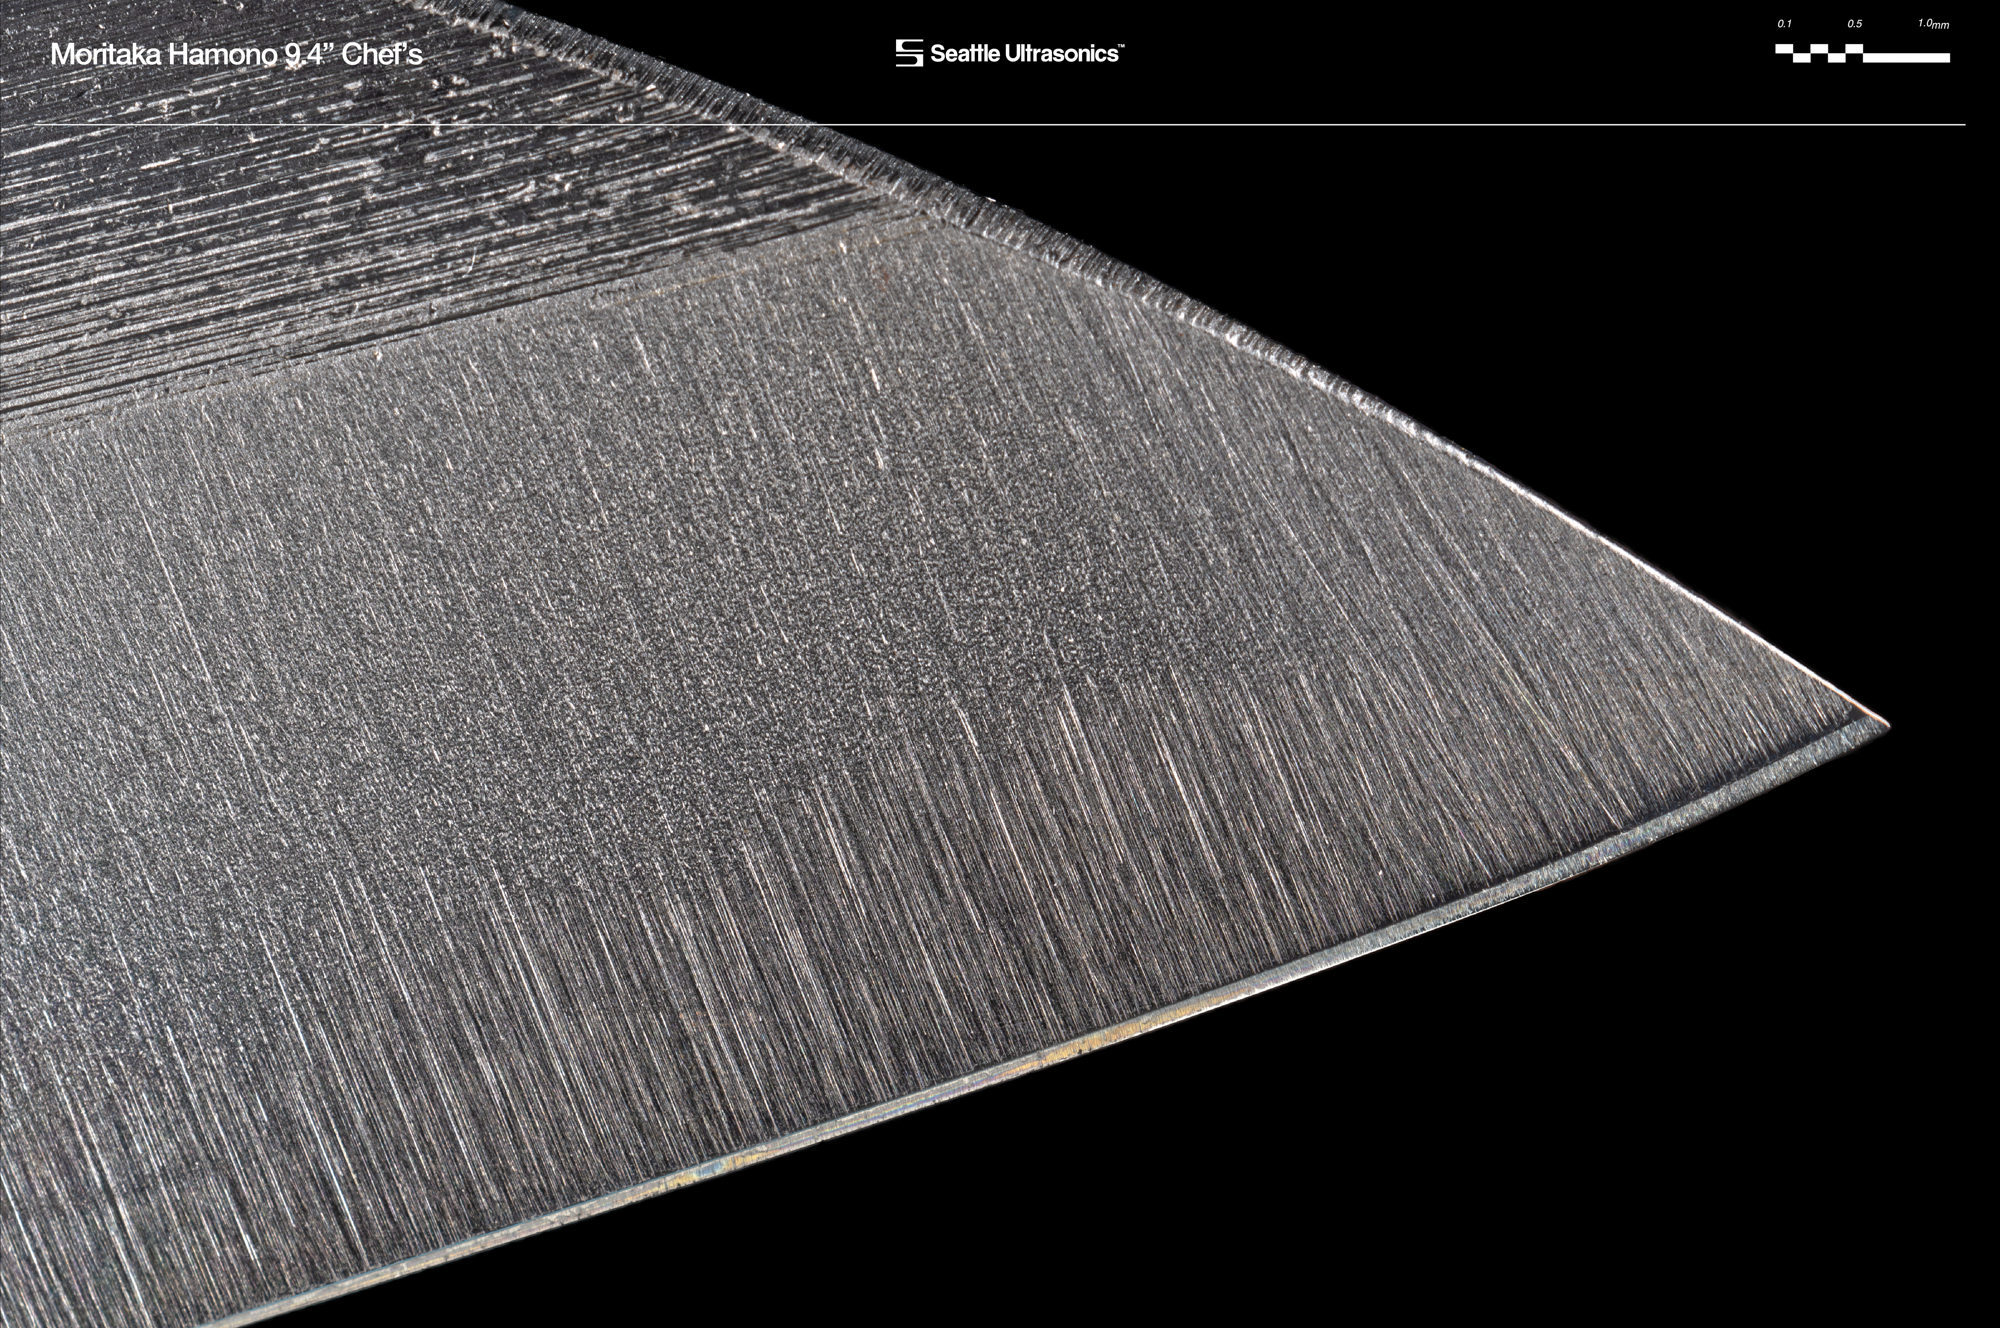
Before each knife was subjected to cutting tests, we photographed the factory edge. The details revealed in these images provide some information about the way the knife is constructed and how the edge was sharpened at the factory. Key details of interest include:
- The presence of burrs, dents, or chips
- The grit direction of the sharpening
- The consistency of the apex along the edge
- The sharpness of the tip
- The straightness and symmetry of the choil (the end of the knife opposite the tip)
CATRA Test
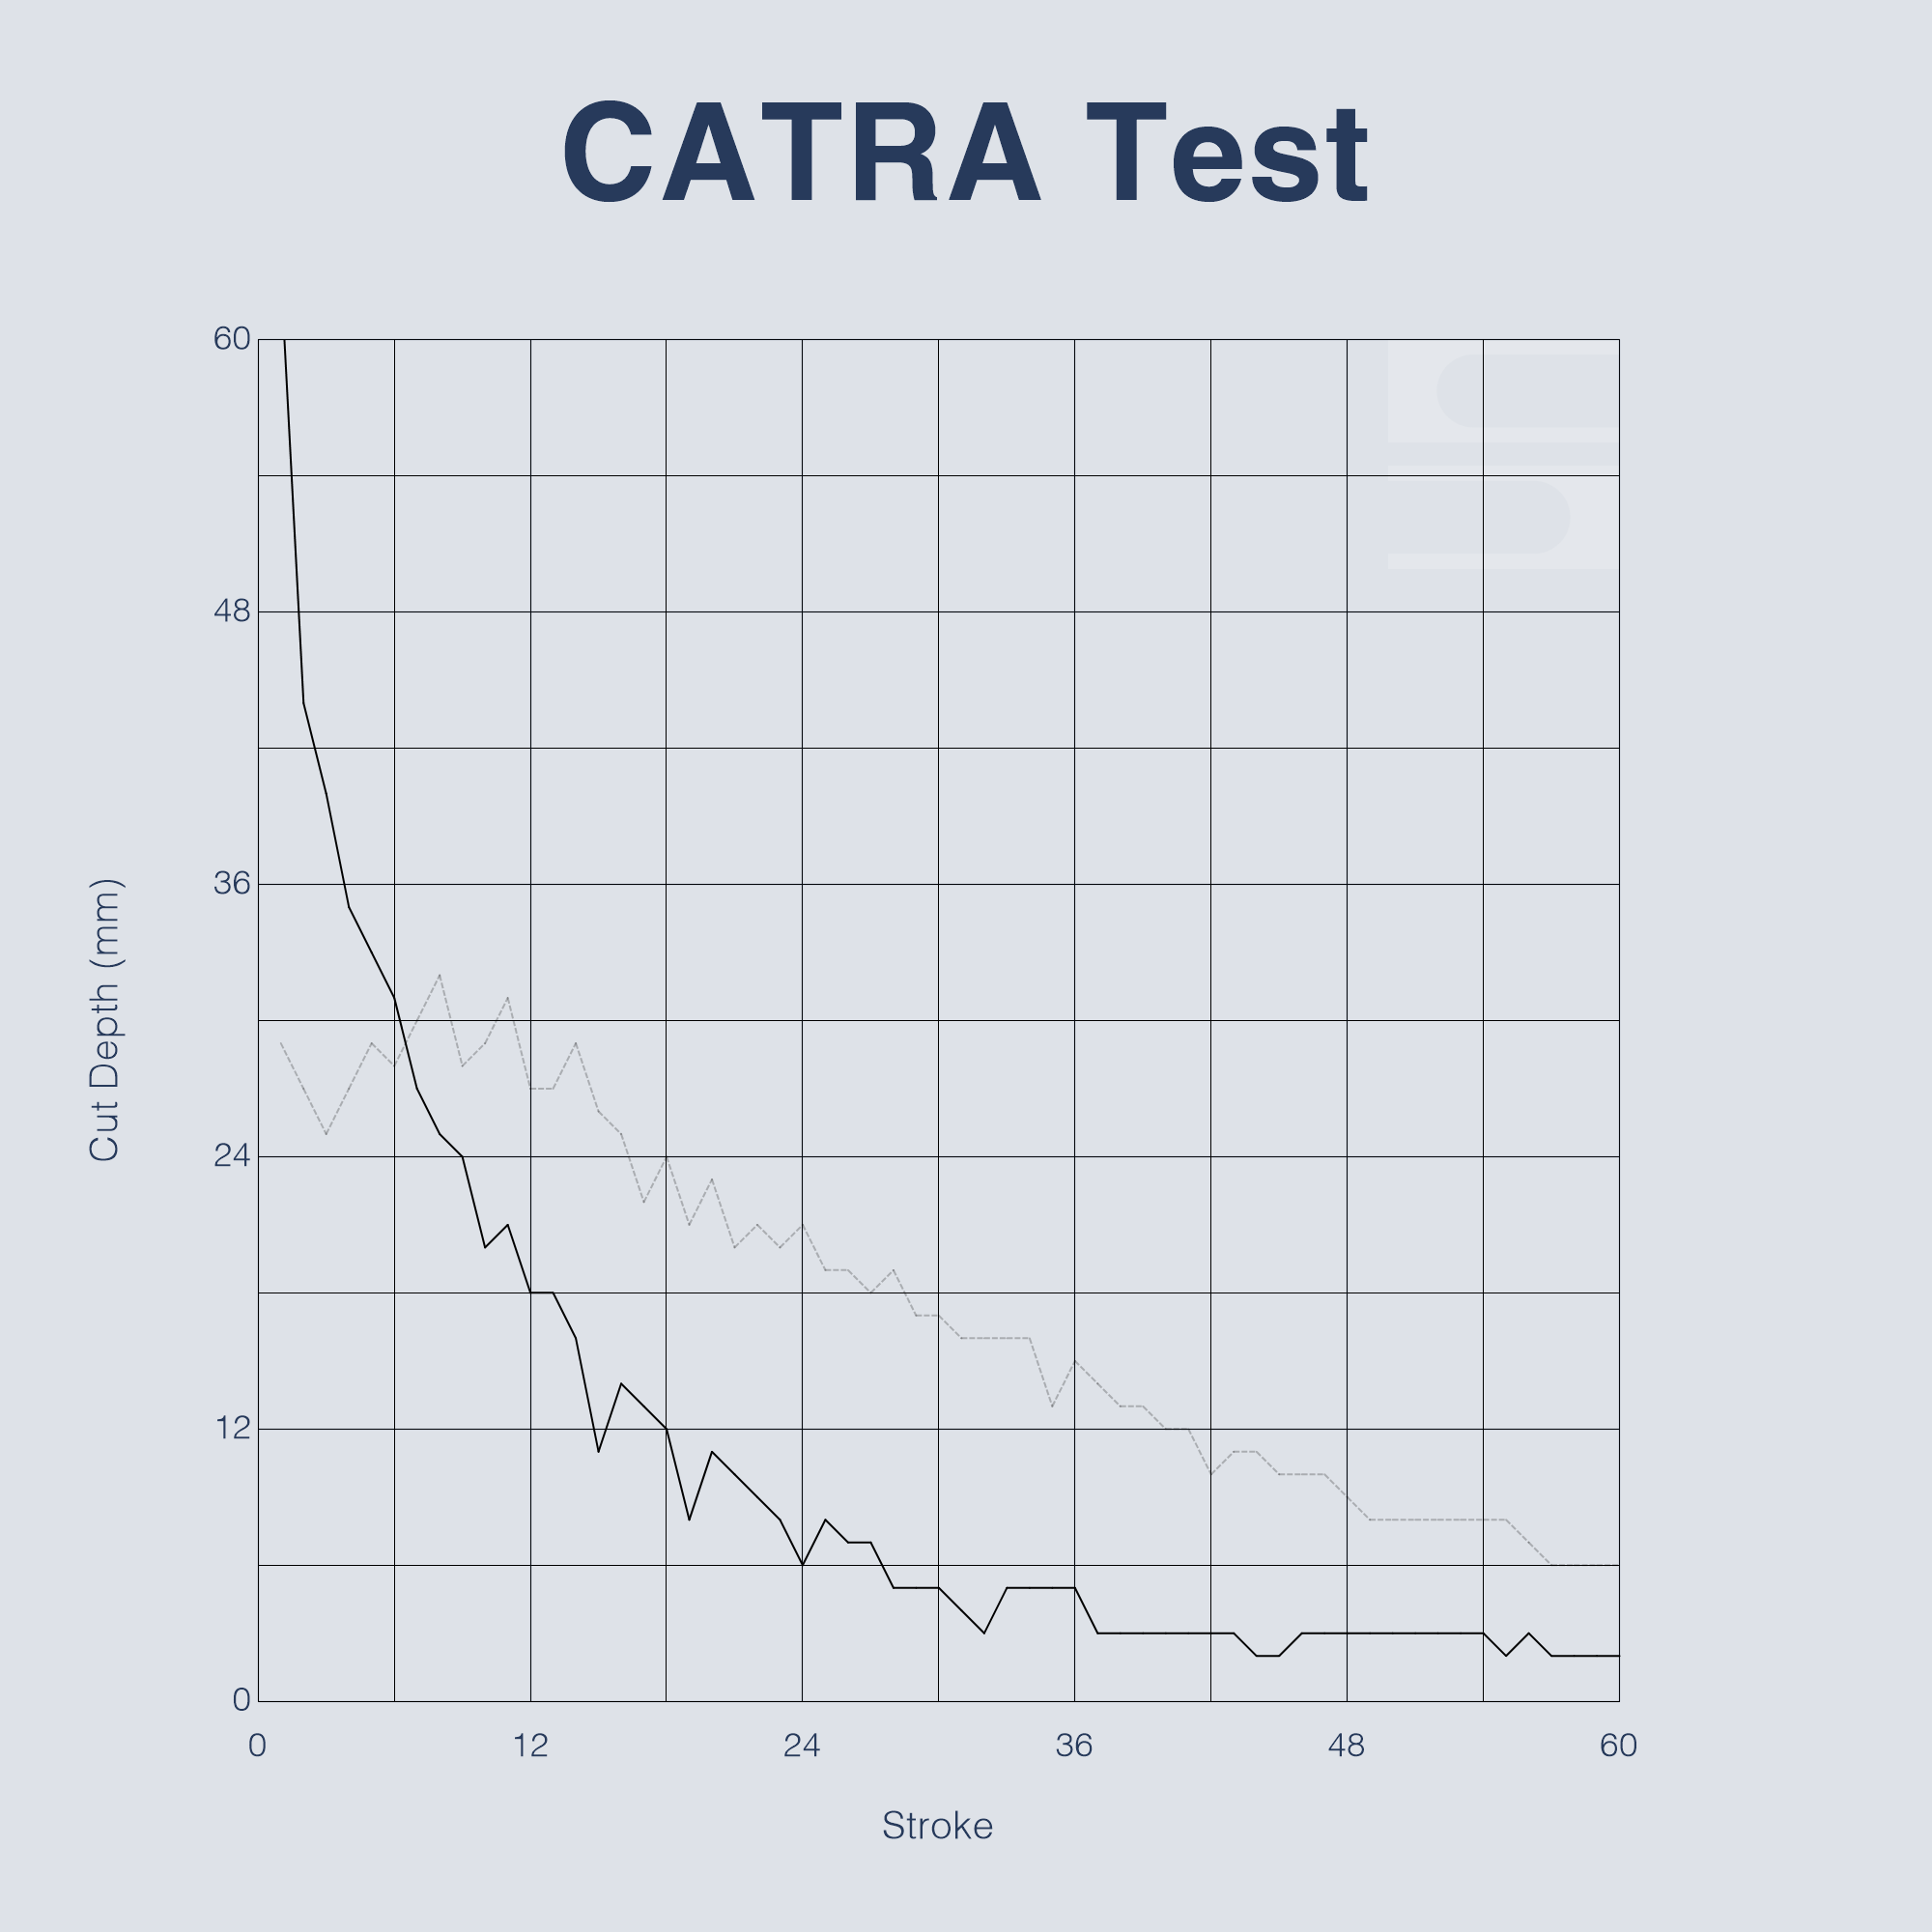
The CATRA test is a standardized measure of sharpness and wear resistance. The folks at CATRA explain it best: “The cutting-edge to be tested is mounted vertically and a pack of specially developed synthetic card is lowered on to it. By moving the blade back and forth repeatedly, the blade cuts into the paper; the depth of the cut being the measurement of sharpness. The test card is loaded with 5% silica, which has a mild wearing effect on the blade edge. The measurement of cut depth at each subsequent stroke can then be plotted to produce a wear curve for each blade tested.”
The two key metrics for CATRA testing are the First Cut Depth, which provides a measure of initial sharpness, and the Total Cardstock Cut, which indicates how well the blade maintains cutting power in response to wear on the cutting edge.
These charts show the results of 60 back-and-forth strokes and the corresponding cut depth for each back-and-forth cycle for a particular knife. The faint gray line shows the performance of the best blade in the testing group as determined by the highest Total Cardstock Cut.
BESS Sharpness Test
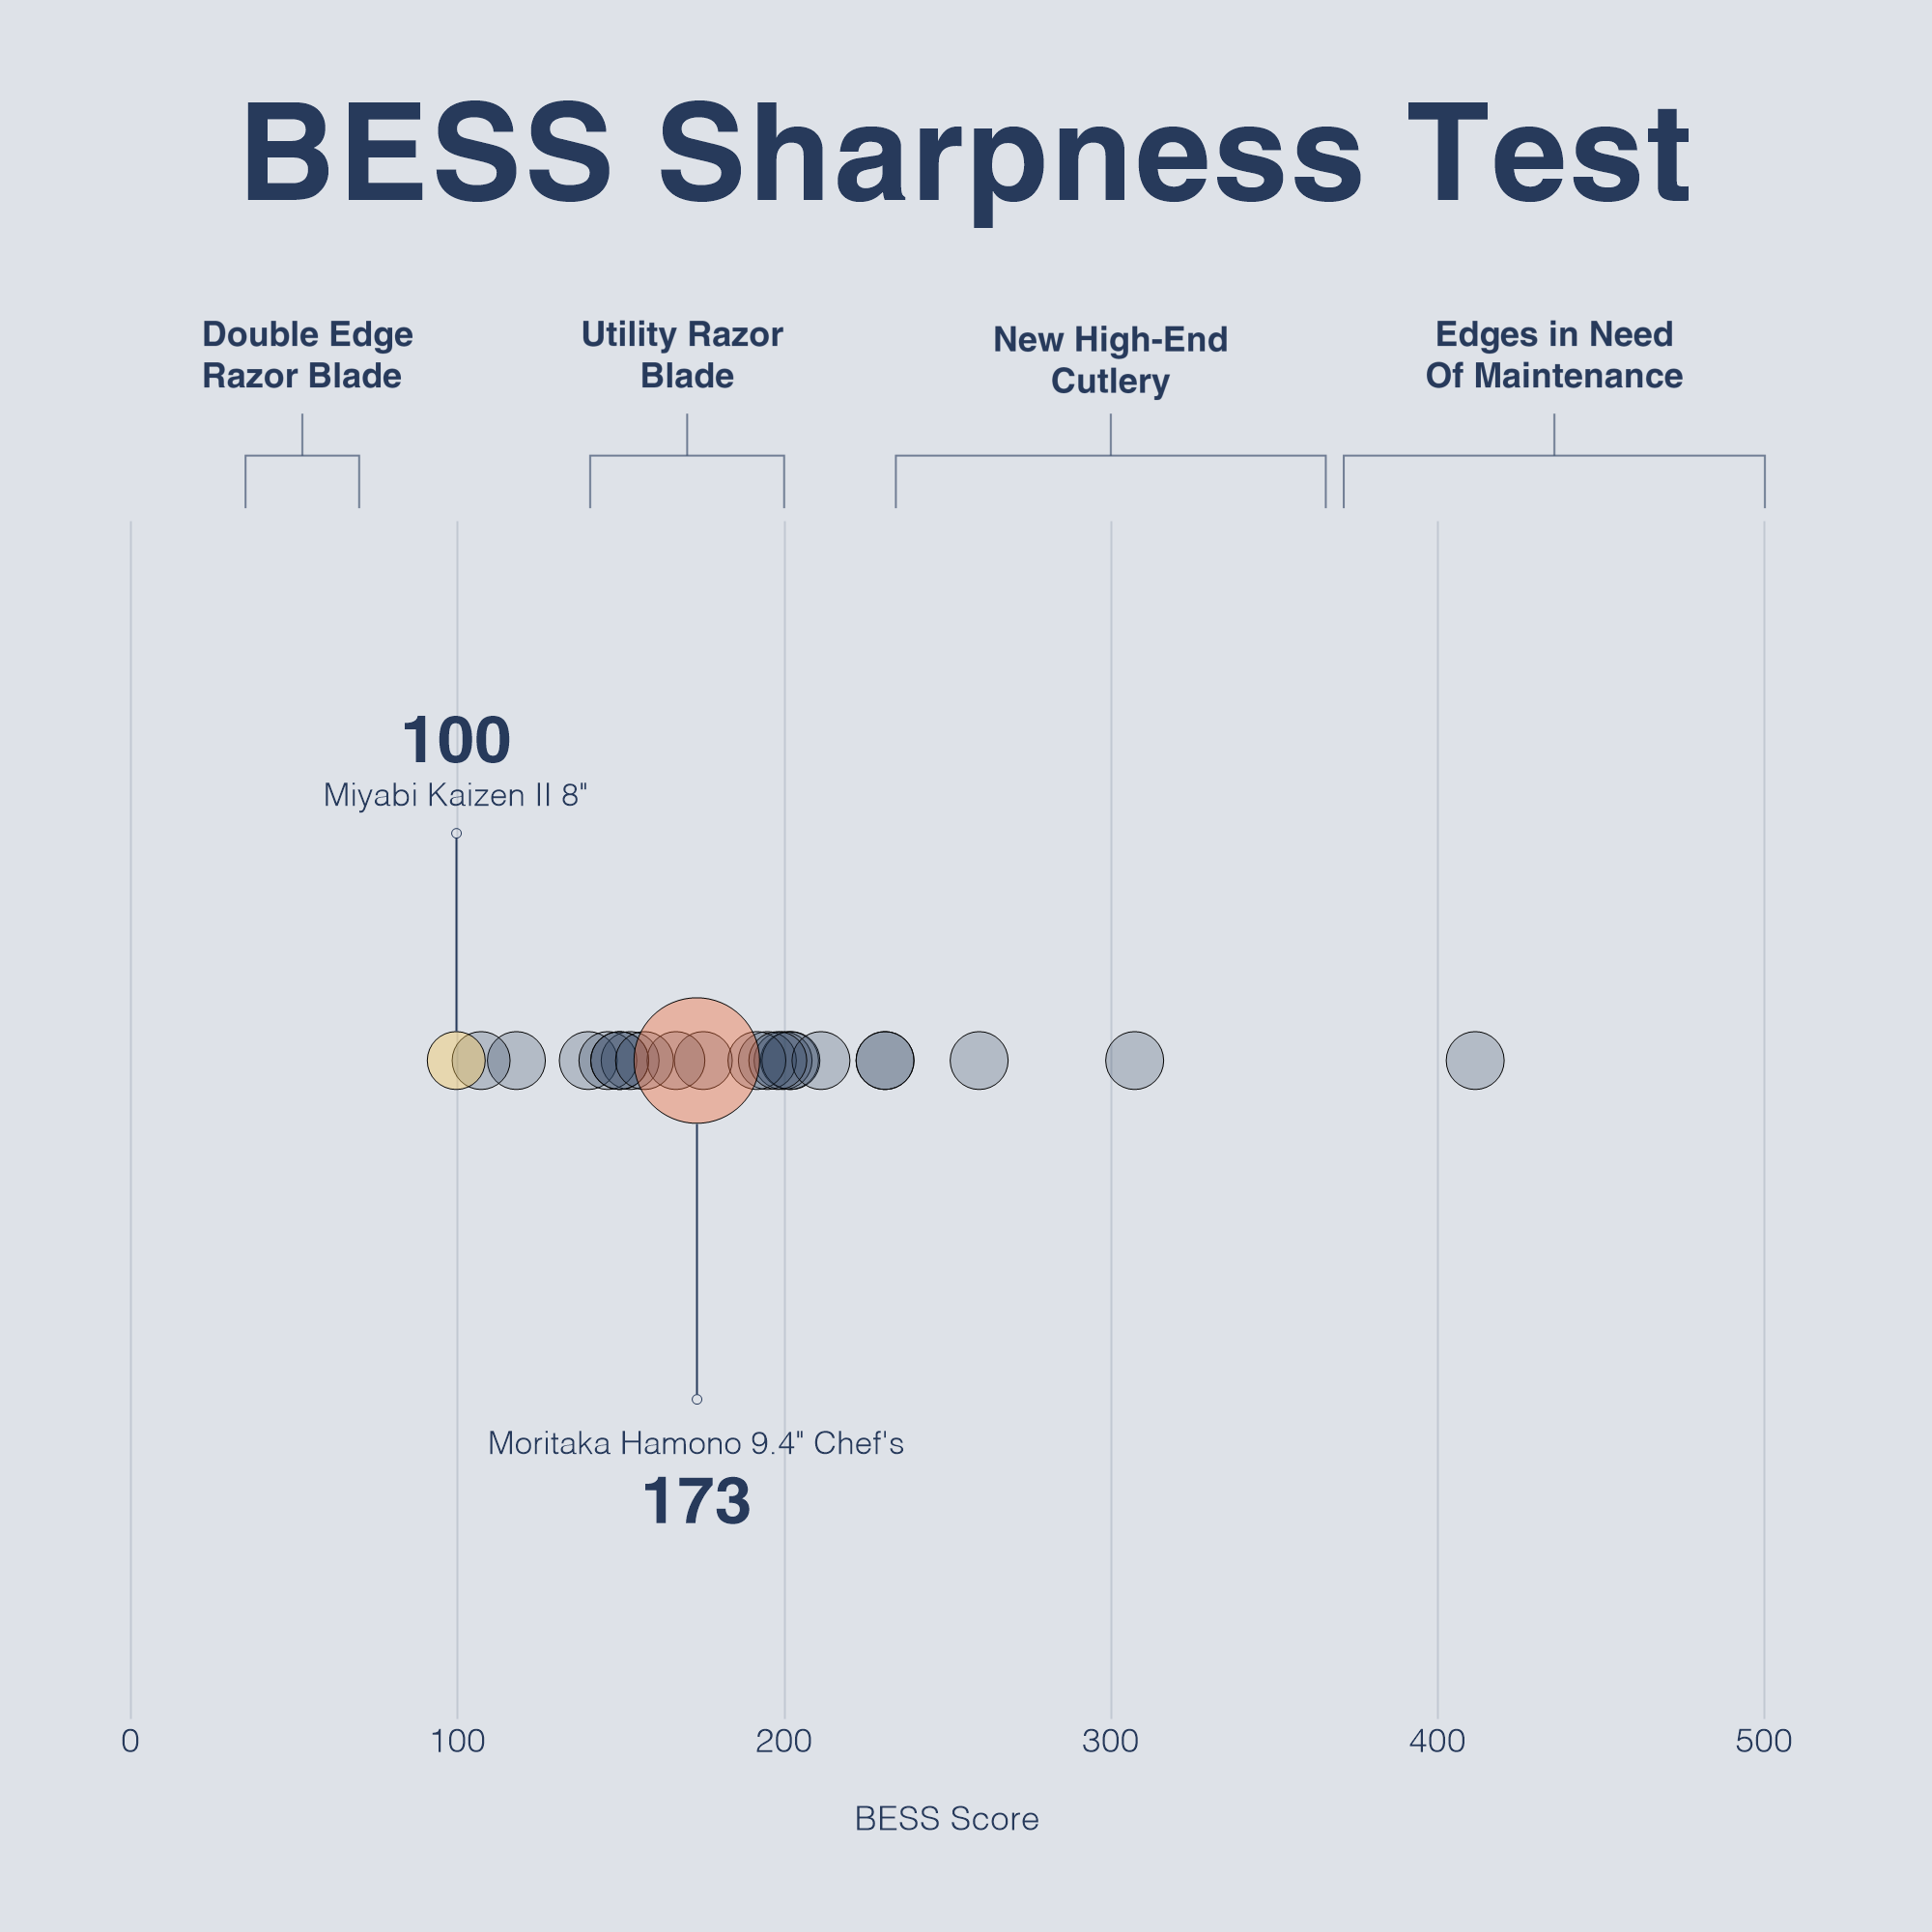
The BESS test measures the maximum force, in grams, required for a blade to cut through a calibrated, synthetic filament. A sharp edge will score a low number; a dull edge will score a high number. This test is widely adopted in the blade community and proves a straightforward way to measure and compare a quantified sharpness metric.
BESS is an acronym for the "Brubacher Edge Sharpness Scale” and is intended to provide a measure of geometric sharpness (known as “keenness”) of a blade edge. In this context, “sharp” refers to how perfectly the apex of the edge is formed.
We tested each blade’s factory edge three times using pre-strung test media, then averaged the scores of those three tests. We multiplied the averages by 1.2 to convert from the pre-strung media value to the standard BESS score, as specified by the makers of the test.
The averages for each blade are represented as circles on the chart. The orange circle shows the average BESS score for the current blade. The yellow circle shows the average BESS score for the best-performing blade in the group. The score range references at the top of the chart are based off of the BESS-C published scale.


